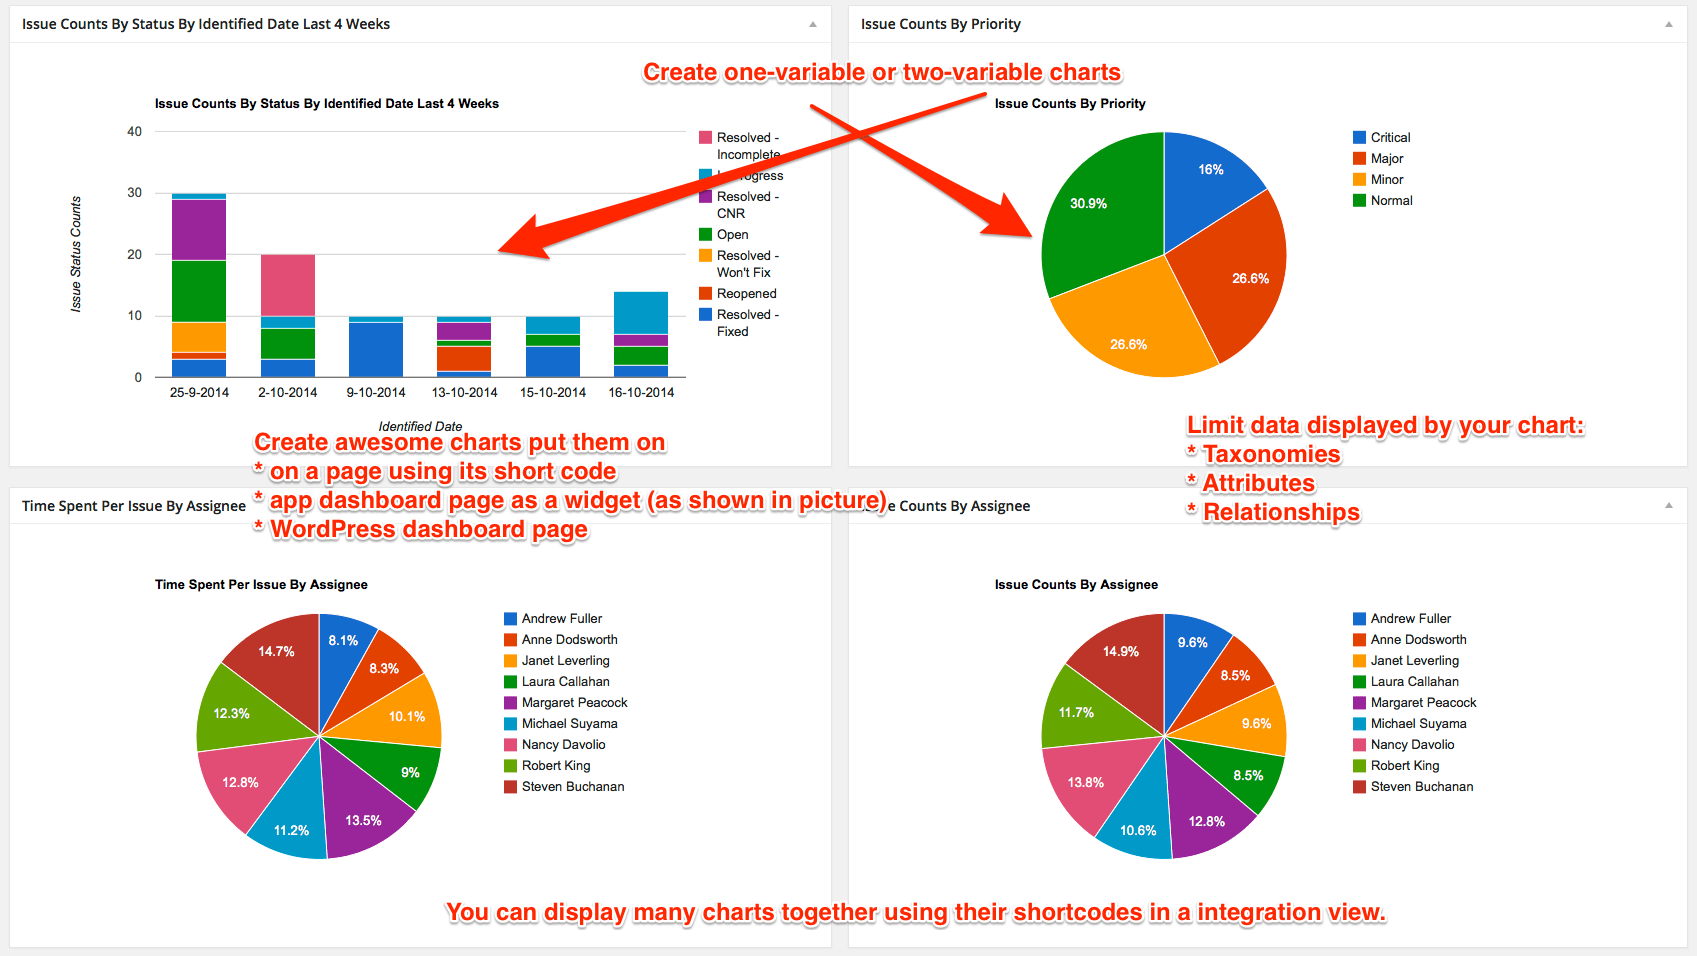
Chart views can be created using one or two variables and produce real-time reports. Charts can be displayed on your app dashboard page or in any page using shortcodes. You can combine multiple charts into one page.
Creating a chart view
- After you created your app, go to Views menu and click Add New
- Add a unique name for your view
- Optionally, put a brief description to describe what your chart displays. It will be shown on the app glossary page after generation.
- Select Chart from Type
- Attach to an entity to get your chart data.
- Configure your chart using the layout image on the left as a sample.
- Click Save to finish.